Cluster Analysis is an unsupervised machine learning technique used to group similar data points into clusters based on their features or characteristics. It aims to identify natural groupings in a dataset without predefined labels or categories.
Key Features of Cluster Analysis
- Unsupervised Learning: No labeled data is required for training.
- Similarity-Based: Clustering groups data points based on similarity measures like distance metrics.
- Exploratory Data Analysis: Often used to uncover hidden patterns in data.
Applications of Cluster Analysis
- Customer Segmentation: Group customers based on purchasing behavior.
- Market Research: Identify groups with similar preferences or demographics.
- Image Segmentation: Partition images into regions for object detection.
- Social Network Analysis: Detect communities within networks.
- Anomaly Detection: Identify outliers in financial transactions or network traffic.
Types of Clustering
- Hard Clustering: Each data point belongs to exactly one cluster.
- Example: K-Means.
- Soft Clustering: Data points can belong to multiple clusters with varying probabilities.
- Example: Fuzzy C-Means.
Common Clustering Algorithms
- K-Means Clustering
- Divides data into kkk clusters by minimizing intra-cluster variance.
- Iterative process with the following steps:
- Initialize cluster centroids.
- Assign points to the nearest centroid.
- Update centroids based on assigned points.
- Hierarchical Clustering
- Builds a tree of clusters either:
- Agglomerative (bottom-up): Starts with individual data points and merges them.
- Divisive (top-down): Starts with a single cluster and splits it.
- Builds a tree of clusters either:
- DBSCAN (Density-Based Spatial Clustering of Applications with Noise)
- Groups data points based on density and identifies noise (outliers).
- Ideal for clusters of varying shapes.
- Gaussian Mixture Models (GMM)
- Assumes data is generated from a mixture of several Gaussian distributions.
- Soft clustering approach.
- Fuzzy C-Means
- Similar to K-Means but allows each data point to belong to multiple clusters with varying degrees of membership.
- Mean-Shift Clustering
- Identifies dense regions in the data space and assigns clusters based on those regions.
Steps in Cluster Analysis
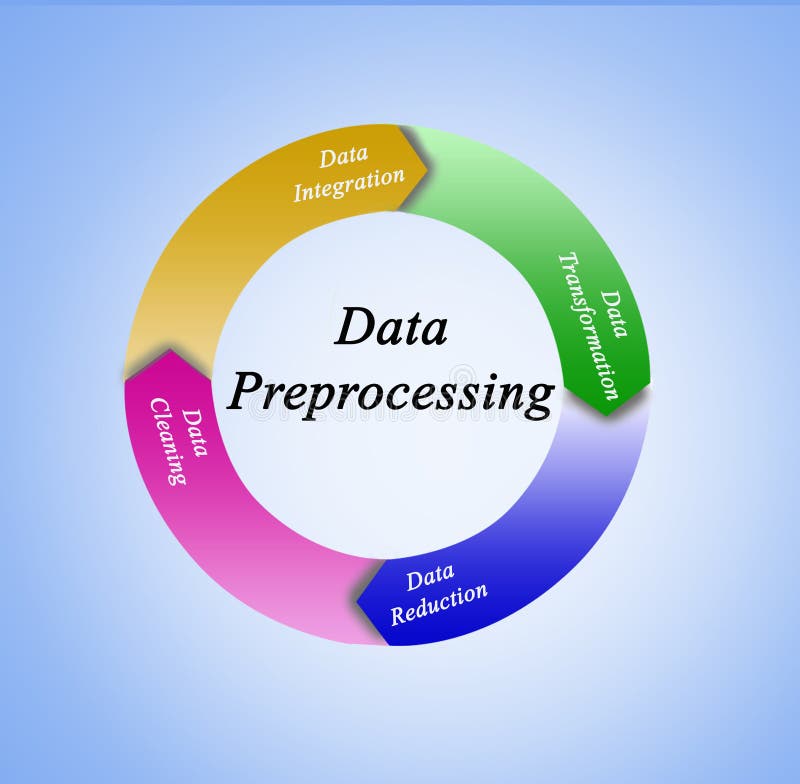
- Data Preprocessing
- Handle missing values, remove outliers, and normalize features to ensure fair distance computation.
- Choose a Clustering Algorithm
- Select based on dataset characteristics (e.g., size, distribution, noise).
- Determine the Number of Clusters
- Use methods like the Elbow Method, Silhouette Score, or Gap Statistics.
- Apply Clustering Algorithm
- Execute the chosen algorithm on the dataset.
- Evaluate the Clusters
- Assess the quality of clustering using metrics like Silhouette Score, Dunn Index, or DB Index.
- Interpret and Visualize
- Visualize clusters using scatter plots, dendrograms, or PCA for dimensionality reduction.
Challenges in Cluster Analysis
- Determining the Number of Clusters: Selecting the optimal number of clusters can be non-trivial.
- Scalability: Processing large datasets can be computationally expensive.
- High-Dimensional Data: Clustering becomes complex in high dimensions due to the curse of dimensionality.
- Cluster Shape and Size: Algorithms like K-Means assume spherical clusters, which might not fit real-world data.
- Outliers: Sensitive algorithms like K-Means can be affected by outliers.
Evaluation Metrics
- Silhouette Score: Measures how similar a data point is to its cluster compared to other clusters.Silhouette Score=b−amax(a,b)\text{Silhouette Score} = \frac{b – a}{\max(a, b)}Silhouette Score=max(a,b)b−aWhere:
- aaa: Average intra-cluster distance.
- bbb: Average nearest-cluster distance.
- Davies-Bouldin Index (DB Index): Evaluates intra-cluster compactness and inter-cluster separation. Lower values indicate better clustering.
- Dunn Index: Ratio of minimum inter-cluster distance to maximum intra-cluster distance. Higher values are better.
- Calinski-Harabasz Index: Ratio of between-cluster dispersion to within-cluster dispersion.
Conclusion
Cluster analysis is a versatile and powerful tool for discovering hidden patterns in data. Choosing the right algorithm and preprocessing techniques ensures meaningful and actionable insights. It plays a vital role across domains, from business intelligence to scientific research.


